

Over the last few years I've been molding an idea in my mind that I'd like to finally share with the world. The idea in a nutshell is to clearly define a peak state that a company should aim to reach in terms of its' business intelligence. I'm calling this state, BI Competency Status. I believe every company should try and achieve BI Competency Status and it's the gold standard that every COO and analytics manager should work towards.

Reaching BI Competency Status is like climbing a mountain, once you've reached the summit, you've gained the status. Like a mountain, many start the climb, not everyone makes it to the summit.
What is BI Competency Status?
A business has reached BI Competency Status once ALL the following milestones have been reached:
Assign a head of data / BI
Reaching BI competency status is a marathon, not a sprint. It will take many months and a lot of resources. A project of such magnitude needs a leader. The very first thing you must do if you want your company to reach BI competency status is to assign a head of data. You might call this person the head of analytics, the director of business performance, or VP decision science. The title doesn't matter. What does matter is that this individual needs to clearly understand the mission and lead it.
The ideal candidate is someone who checks the following boxes:
- Naturally data-driven
- Loves to solve puzzles
- Organized and a strong communicator
- Good with people (ideally someone with past managerial experience and a good record)
- Highly intelligent and a logical / technical thinker
- A quick learner
- Patient and hard working
If such a person already exists in your organization then I'd highly recommend considering promoting them to this role. Someone that has worked with your data and knows the ins and outs of your organization will be able to move faster than an outsider.
I was promoted into the director of business performance role at my previous company and was fortunate enough to be paired from day 1 with a mentor that had previous experience setting up the BI at large global organizations.
If you are going to promote someone from within then I'd recommend you find them a mentor or at the very least encourage them to meet with other heads of data at more mature companies.
Implemented a centralized single source of truth for the company's operational data
Once the head of BI is in place he'll need to get to work establishing a data warehouse. The data warehouse will act as the single source of truth for the company's operations data. In other words, the information stored in the data warehouse will be used to determine facts about the operations of the company that will be used for decision making.
A data warehouse also allows you to scale the number of individuals accessing data in the organization. The more individuals accessing data, the more data-driven your company will be. The value you will get from your business analysts will be significantly lower without a data warehouse. For this reason I recommend holding off on hiring a team of analysts until the data warehouse is in place.
I highly recommend that startups consider best-in-class solutions like BigQuery, Redshift, or Postgres for their data warehouse. If you're on the Google Cloud Platform then I highly recommend that you go with BigQuery which is my number one choice for a data warehouse.
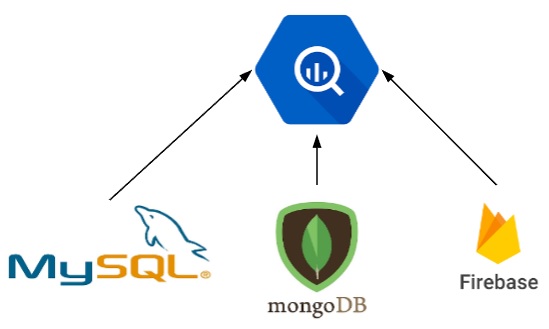
In the diagram above you see that 3 data silos, MySQL and MongoDB databases, and the Firebase analytics platform, are connected to BigQuery, the data warehouse. Your head of BI will need to draw up his own data pipeline diagraph and make sure that each major data silo is included.
All the relevant data in all major data silos are being ETLed into the data warehouse
Now that you've got a data warehouse in place it's critical that your operational data is being moved from their sources to the data warehouse.
There are a number of different approaches which you can take to ETL (extract, transform, load) your data. Stitch, Funnel.io and Rivery are some of the more popular out of the box solutions you should consider.
Some organizations prefer to develop the ETL code themselves and build API integrations between their own environment and the different data silos. There are pros and cons with each approach.
The main differences between going with 3rd party ETL solutions and developing the code yourself is in cost and speed. 3rd part solutions will be significantly quicker and in most cases cheaper to use compared to hiring a data engineer and writing the code yourself. Writing the code yourself means you own the code and have more flexibility.
Whichever approach you take, it's critical that the top data silos are covered in your data pipeline plan.
Your CRM (customer relationship management), application database, event tracking solution, and support tool should be top priority.
Full historical data analysis capabilities for all major business entities
One of the most common issues I've seen among my clients is the lack of historical data. The biggest data gaps that startups have are in this area. What I mean by historical data is data that can be used to measure behavior over time. Lets take an example to layout this concept in more detail.
Say you have a feature which can be turned on and off by clicking a button within your application.
In most cases the current state of the button is recorded in the database. You'd see a boolean value which will tell you if, for a specific user, the feature is enabled or disabled. You may even have a timestamp of the last time the status of feature was changed.

The issue here is that the data saved in your application database is enough to provide the user experience but not enough to support your BI efforts. There are critical product usage questions which this data can't help you answer.
Here are some examples of these questions:
- How long after the user signs up does it take to enable the feature? - This can't be answered because someone could turn the feature on and then off again and you'll never know when the user turned it on for the first time.
- For users which have turned the feature on and then off, how long did it take them to turn it off after turning it on? - Can't be answered because you only have the most recent timestamp.
- How many times do users turn the feature on and off before keeping it on for 30 days or longer? - Can't be answered because of the same reason as above.
All of the questions above can't be answered without having event-based data (also commonly called history or fact data).
In the end you need a data structure which looks something like what's shown below.

From the hypothetical data set above we can see that user with id 1334 turned on the feature on the 27th November 2019 and then disabled it the next day and re-enabled it the following day. We can easily use date_diff formulas in SQL or a tool like Tableau to calculate time difference between the events and easily count the number of times the user enabled and disabled the feature. We also have the most current status of the feature for this specific user which is the most recent row.
Product analytics is only one area where historical data is important. In a perfect world all the tools you use will create historical data for major actions and events which can be easily passed to your data warehouse.
For more information on identifying your data gaps and building an action plan to start filling in the gaps check out this post on conducting a data audit.
Implemented executive level reporting AKA "turn on the lights"
Now that your BI infra is improved and you have the capabilities to run complex operational analyses it's time to move onto the next stage. It's now time to "turn on the lights" in the organization starting with the top dogs.
Data is only helpful if it's easily accessible and digestible by decision makers. The first group that you need to make happy are the company's executives. I include in this list all the C-level management. Your CEO, CFO, COO, CMO and CPO / head of product need to be your focus.
I recommend starting with an executive-level dashboard which has the CEO and CFO as the main consumers but also includes key KPIs related to the chief marketing officer and head of product. This dashboard should focus on high-level KPIs relating to growth, sales, profit and other major drivers of the business. NPS, user growth, retention and lead pipeline are also other common KPIs which could be included in such a dashboard.
You have a number of great data visualization solutions on the market today. My recommendation is Tableau which is both affordable and the market leader.
Building an executive dashboard is not a quick or easy process. You will need to work closely with the CEO and other C-level managers to understand exactly how they measure the business and how they like to see metrics. Once that is complete you'll need to plan your data models and start development.
Expect the project to take a few weeks to more than a month to complete, especially if the head of BI is doing everything at this stage.

Help the team leaders and directors understand what's working and what's not
Once the executives are happy with their dashboard/s you need to move down to the next category of decision makers, the directors and team leaders. At this stage you should have some help in the form of one or two senior analysts that can help you spread the work load.
Recommended post: The complete guide to hiring your first business analyst.
The focus of the BI team should be helping the managers come up with clear KPIs so the focus can shift to the development of reporting and assisting with key analyses. At this point there should be exponential growth in the understanding of how the business functions at the granular level. Everyone from the marketing manager to the CEO should become more knowledgeable on the drivers of the business.
The process of building, maintaining and improving dashboards for management is never ending. You'll want to put good processes in place at this point to make sure your analysts aren't overloaded and the workflow is managed correctly.
The head of BI's job will move from executing to putting out fires and managing his team.
Implemented predictive analysis and reporting for key business drivers
Now that the decision makers in the organization have their own dashboards and understand their areas of the business at a very granular level it's time to take the BI to the next level.
As the head of BI you'll want to preserve the work you've done and make sure you're keeping your stakeholders happy while also findings ways to expand your influence and the value you bring.
The best way to do this at this point is to develop predictive capabilities and advanced reporting so you can help the C-level "see the future". By this stage you've spent hundreds of hours looking over the drivers of the business and you should have a good idea on what moves the needles. You want to try and convert this knowledge into basic algorithms and then turn them into reports.
I managed to do this at my previous company by spending a huge amount of time looking at the sales frequencies at different times of the month. By the halfway mark each month I was able to predict how much the company would close to within a few percentage points most months.
If your company has data scientists then I'd consult with them and together come up with some useful algorithms which help predict how the company will perform in the future.
Implement data ops, a data dictionary and maintain a reasonable analyst-to-consumer ratio
Congrats, you've climbed up most of the BI mountain and you can see the summit just off in the distance. Before you can reach the summit there is one last hurdle you need to climb.
That hurdle is putting in place a safety net to preserve all the hard work you've done, and allow you and your team to scale along side the company.
This safety net exists in the form of data ops, data governance policies and a healthy team of killer analysts.
What the hell is data ops?
Data ops can mean different things to different people but the way I see it is a team of individuals that are responsible for data collection at the code / system level. These are generally dev ops or data engineers which use monitoring tools and alert systems to keep an eye on the flow of data between your numerous sources and the data warehouse.
If you don't have at least someone keeping an eye on your data flows you'll constantly run into issues with data integrity and even worse, lost data which cannot be recovered. Your analysts will become the enemy to management and trust will be lost. Things can fall apart quickly and data ops can act as a fast response team at times of crisis.
My advice would be to slowly edge your dev ops team to take on some of the data ops responsibilities, or hire a data engineering team leader who can own this area.
Draw up a data dictionary
I'm not the biggest fan of documentation since things are constantly changing but you do need at the very least a data dictionary. A data dictionary is extremely helpful for aligning everyone on the terminology used to describe the operational metrics and entities of the business.
If your marketing manager uses "leads" while your CMO users "contacts" soon you'll have a breakdown in communication and even worse, errors in how the performance of the company is reported to decision makers.
Maintain a reasonable analyst-to-consumer ratio
Unfortunately the company's business analysts are more often than not seen as an expense rather than an investment. For this reason the head of BI will struggle to get approval to hire more and more analysts as the company scales. This can result in a situation where every analyst is serving dozens of consumers.
The head of BI should fight to maintain a reasonable analyst-to-consumer ratio which makes sense to everyone involved. No one wants their analysts to burn out and leave the company but the quickest way to destroy moral is to unreasonably overload your workforce.
Since your analysts are directly working with others in the organization it can be extremely tough when their hard work goes without recognition by management who refuses to help the team scale.
There is no magic analyst-to-consumer ratio. It all depends on the nature of the work, the excellence of your analysts and the needs of the organization. The head of BI will have to make a judgement call.


