


I recently had a conversation with a friend who was considering joining a new company. He reached out to discuss the opportunity with me and to get my opinion on his salary expectations if he joined the company.
Determining the salary you think you should get paid can be tough. The fact that a business analyst can wear many hats (product analyst, marketing analyst, financial analyst, etc) and have a wide range of skills only makes it tougher to come up with a number that makes sense.
I thought it would be interesting to build a data set which contains the salary ranges for business analysts around the world. This data would help me better understand the average salary for analysts in different geographies, and act as a resource I can share in the future.
In this post I'm going to show you how I built my data set and how you can use it to compare your salary range as a business analyst to other cities and countries in your region of the world. If you are wondering how much you should ask for as a business analyst, this post will help you answer that question.
The "Business Analyst Salary Ranges Around The World" Spreadsheet
Sample size, nuances and other salary data issues
Before you quit your job because you think you're significantly under paid thanks to my spreadsheet, consider the information below.
Issues with the title, business analyst
Every company has nuanced differences when it comes to their jobs. I'll give you one good example.
In Israel there is a well-known tech company which has business analysts on staff. These analysts work directly with consumers and perform the typical role of a business analyst. The thing is these analysts DONT build dashboards. Instead the company has a different analyst role, BI front-end developers.
In my previous company my team of analysts did the same job as the analysts in the other company but also built dashboards. You have 2 companies with the same position but different responsibilities.
The reason this is significant is because so often a company will set their salaries based on the title and market value of the analyst, not on responsibilities.
Small sample sizes can dramatically skew the salary ranges
You'll notice that some cities in my spreadsheet have sample sizes of a few dozens or less.
In these cases you should be very careful in making decisions on your expected salary. If you combine the issue above with the fact that you have a small sample size, you could be completely off when it comes to your true salary.
In a case like this I'd recommend talking directly with business analysts in your geography and ask them for the salary range. After speaking to a few analysts you should get a general idea where the range is.
Not sure where to meet business analysts? LinkedIn, meetups and Facebook groups are a great way to get started.
Lack of historical awareness
Economies are constantly changing and it isn't clear the time range of the data that Glassdoor provides.
I did notice that for each search Glassdoor lets you know when the info was last updated. This does make me feel better about the info shown but I'd recommend that you double check the average base pay against active job listings on LinkedIn or jobs boards like RemoteOK.

How I built the salary ranges spreadsheet
The most reliable salary data set that I'm aware of belongs to Glassdoor. Glassdoor is a website where former employees can review companies anonymously.
One of the pieces of information which employees can send to Glassdoor is their salary. Glassdoor has hundreds of thousands of data points on popular job titles in hundreds of cities around the world.
In order to build my spreadsheet I manually searched for salary information for the business analyst position in major cities around the world.

In the screenshot above you see a search I ran for business analyst salaries in London. In the search result we see the average base pay of 43,080 pounds per year while the range is between 30k and 70k pounds per year.
I copied these data points into my spreadsheet and added a few helper columns including country, city, region, currency and the current conversion rate of the countries currency in dollars. I wanted to normalize the data into US dollars as this gives me a rough idea on the global market value of an analyst.
Since I work remotely with clients this information is very valuable for me as an analytics freelancer.
Which countries are included in the salary ranges spreadsheet?
I used common sense and the ProjectBI Google Analytics account to come up with my list of countries.
The countries I've included in the spreadsheet are:
- Australia
- Brazil
- Canada
- France
- Germany
- Greece
- Hong Kong
- Hungary
- India
- Indonesia
- Israel
- Italy
- Netherlands
- Poland
- Portugal
- Russia
- Singapore
- Spain
- South Africa
- Switzerland
- United Kingdom
- United States
This list is not made in stone and I imagine I'll add more countries and cities to the spreadsheet as time goes by.
Which cities are included in the salary ranges spreadsheet?
Since there are major differences in salary from one city to the next I didn't stop at country. In total the spreadsheet includes 42 cities from Washington, DC to Jakarta and Milan. I picked these cities using the same logic I used to pick the countries I listed above.
The cities I've include in the spreadsheet:
- Amsterdam
- Athens
- Atlanta
- Austin
- Bangalore
- Barcelona
- Berlin
- Boston
- Bristol
- Budapest
- Chennai
- Chicago
- Dublin
- Frankfurt
- Houston
- Hyderabad
- Jakarta
- Johannesburg
- Lisbon
- London
- Los Angeles
- Madrid
- Melbourne
- Milan
- Moscow
- Mumbai
- Munich
- New York City
- Paris
- Pune
- Salt Lake City
- San Francisco
- San Jose
- Sao Paulo
- Seattle
- Sydney
- Tel Aviv-Yafo
- Toronto
- Vancouver
- Warsaw
- Washington
- Zurich
The sample size of salaries for each city differs a lot. I would have included many more cities but some had very few data points.
How should I use the salary ranges spreadsheet?
The best way to use the business analyst salary spreadsheet is by filtering out countries which aren't interesting to you. You can do this quickly by using the slicer in the top left hand corner of the spreadsheet.

Simply click on "All", click on Clear and then re-select your country.
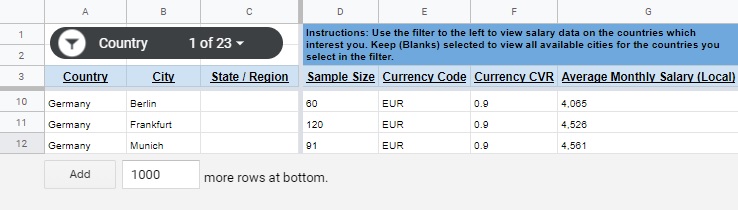
You can select multiple countries so you can compare the ranges between your country and others in the region.
The Average Monthly Salary (Local), Low End (Local) and High End (Local) columns show values in the local currency (the currency code is listed in column E).


