


A data audit is a process in which a company prepares a detailed report on the overall health of its data infrastructure and analytical capabilities.
The main goal of the data audit is to align the management on the current state of the company's business intelligence; in other words, what information and resources are available to managers that want to make data-driven decisions. This is critical for strategic planning and determining risk within the company.
Say for example a company lacks visibility into the performance of its salesforce. If the company plans to scale this area of the business aggressively, everyone needs to be aligned that certain decisions will need to be made without data.
Knowing what can and can't be calculated is critical for a company, and a data audit addresses this need.
What is a data audit?
A data audit is a process in which a company prepares a detailed report on the overall health of its data infrastructure and analytical capabilities.
The main goal of the data audit is to align the management on the current state of the company's business intelligence; in other words, what information and resources are available to managers that want to make data-driven decisions. This is critical for strategic planning and determining risk within the company.
Say for example a company lacks visibility into the performance of its salesforce. If the company plans to scale this area of the business aggressively, everyone needs to be aligned that certain decisions will need to be made without data.
Knowing what can and can't be calculated is critical for a company, and a data audit addresses this need.
How frequently should a startup conduct a data audit?
A truly data-driven company will run a data audit every 12 to 18 months depending on the stage, health and challenges of the company. If you are just starting to build out your business intelligence then a data audit is one of the first things you should do.
The audit should be conducted by the head of BI or the closest role in the company to that position. By the time you have a small team of analysts this work can be assigned to different analysts on the team.
Sections of a data audit
A complete data audit will cover all major aspects of a company's business intelligence. I separate these aspects into the following areas:
- Data infrastructure
- BI penetration
- BI coverage and satisfaction level
Even though I recommend covering all the sections I listed above, it's better to cover part of the list then none of it.
BI infrastructure
I consider the first section, data infrastructure, by far the most critical part of the data audit, especially if you are just starting your business intelligence efforts.
A startup will typically start investing in business intelligence a few years in once there is product market fit and the company is seeing significant growth and revenues. At this stage the company's data infrastructure will most likely have many data gaps since a BI-friendly back-end is not a high priority early on in a startups life. These are obviously generalities and there is a wide spectrum when it comes to the different levels of quality of startups' data infrastructure.
The best way to start mapping out these gaps is to start from a macro level per department. I recommend using Lucidchart (I'm a huge fan and affiliate of the service) to help map things out. Below are examples for hypothetical product and sales teams.
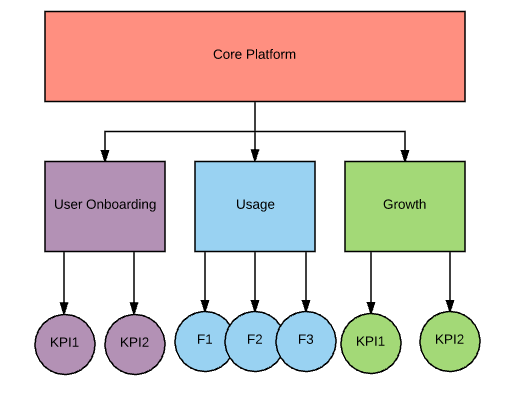

Once you have a sense of the high-level questions that are important to the different departments in the company you will be on your way to map out the infrastructural gaps.
Once you've got a high-level understanding of the needs of each department you can start recording the gaps in a Google Spreadsheet or Excel file as shown below.

To access the data gaps spreadsheet template I used in the table above, click here.
You can get into the details when building such a spreadsheet but be careful to not get too carried away. You will find that you can group your questions into categories. Typically if you can answer one example in the category you will be able to answer all the questions in that category. I'm a fan of getting as granular as possible but you will need to balance depth and speed of execution.
Another important point is the spreadsheet is meant to serve mainly the individuals who will help fill in the gaps, namely the developers. The spreadsheet is too granular for the VP and C-level but should still be used to help summarize the gaps.
Other tips for mapping out your infrastructure gaps:
- Make sure you spend time with the CTO or VP of R&D to understand their plans and current infra roadmap. You may find that R&D are already planning to fill in many of the gaps you are mapping out. This will be important to highlight in your report.
- Spend time investigating the key tools being used by the different departments. Understand what support, marketing, sales and finance are using and how BI-friendly these tools are. Find out when these tools are up for renewal and if the different department heads are happy with them. This may allow you to push for them to move to a system which has better data exporting, APIs and other analyst-friendly features.
- Make sure you prioritize the data gaps and try your best to estimate the time and resources needed to fill in each gap. Resources are finite and you will need to negotiate for one of the company's most expensive resources, developer time. To help you estimate how long it will take to fill in each gap sit with one or two senior developers in the company who know the work and infrastructure well.
- Consult with the C-level to understand where they are lacking visibility. This will help you with prioritizing your gaps.
Once you have mapped out all the gaps, you will want to include a summary for each department in your report. Below is an example of such a summary for the product department.
Data infra gaps affecting Product:
- High Priority
- Can't measure usage for the following features
- Feature A
- Feature B
- Feature C
- Can't determine time between conversion rate from free to paid
- Time estimation to complete all high priority items - 10 developer days
- Medium Priority
- Can't calculate user engagement rates for the following features:
- Feature B
- Feature C
- Time estimation to complete all medium priority items - 5 developer days
- Low Priority
- Can't assist UX with data on clicks on certain elements in user admin
- Time estimation to complete all low priority items - 2 developer days
Business Impact:
- Unable to accurately measure usage of newly released features
- Unable to accurately measure the performance of product managers
- Unable to accurately measure user onboarding and activation, this means we can't measure the UX team.
Total time to complete all product data gaps - 17 developer days
Next steps:
- Decide on roadmap to fill in the gaps listed above
- Communicate roadmap to product, BI and R&D teams
- Get coding!!
BI penetration
Depending on the stage of your company's business intelligence, this entire section may not be relevant. For companies which have one or more analysts then this section of the data audit is very important.
The idea of measuring BI penetration is to see how much of the company is receiving BI services. The goal of a truly data-driven company should be to provide direct BI services to every relevant employee.
Over time you want to see more and more departments and teams receiving BI services.
So how do you measure BI penetration exactly?

The method I recommend is to break up your consumers into tiers. Your C-level, SVP and VP levels should all be in tier 1. Your directors and team leaders should be tier 2 and the rest should be in tier 3. Note that not every employee in the company should necessarily fall into your consumer bucket. Your tiers are made up of target consumers, individuals that you, the head of BI want to serve.
Once you've grouped your consumers into these tiers you need to determine which of your target consumers are actually getting services from your analysts. Every company will measure this differently but I define "receiving service" as having access to a dashboard or an analyst's time so everyday decision making can take place with the help of data. That is a very basic definition and over time you will want to expand the services you are providing your consumers.
So at this point you have a list of consumers, grouped by tier, and a yes / no indication if they are receiving a service. At this point you can easily calculate your BI penetration.
You want to aim for 100% penetration across all tiers but a more realistic aim would be 90% among tier 1, 70 - 80% among tier 2 and 50 - 60% among tier 3.
BI coverage and satisfaction level
The last part of the data audit is to measure and report on your BI team's coverage and satisfaction level
The aim of this section of the report is to indicate to management your team's ability to meet the demands of your consumers.
An important part of providing BI services to consumers is to measure the happiness of these consumers.
So how do you measure BI coverage?
In its simplest form, BI coverage is a supply and demand calculation.
You need to have a sense of the demands of your consumers and the bandwidth of your team. One way to calculate this is to have a task management system where you can calculate how long it takes the team to deliver on requests. A great tool for this is Asana. I recommend upgrading to Asana's premium service so you can take advantage of custom fields. This will allow you to segment tasks and projects by department and even individual consumers. This will make a huge difference in understanding who is using your services and the level of service you are providing.
If the delivery time is unacceptable in the eyes of your consumers then you have a supply problem. On the opposite end, if your analysts find themselves with too much time on their hands you either need to downsize the team or work on improving penetration and adoption of your services.
A simpler method is to calculate the ratio between analysts and consumers. If you find yourself in a situation that the marketing department have 15 consumers and you have only one analyst that can serve them, you not only have a huge demand / supply mismatch, but also huge redundancy risk within the team. If that analyst leaves or is on vacation, 15 different consumers will be without any service. There is no magic number you want to aim for but as the head of the team you want to make sure things don't get out of control. You want to try and scale at a reasonable rate compared to the rest of the company. I've met companies with one analyst per 20 consumers, and others with one analyst per 50 consumers. You will need to determine the right ratio in your company.
Measuring happiness of your consumers
The last part of our data audit involves determining the satisfaction levels of our consumers. This is a tricky thing to calculate because of all kinds of biases involved with collecting constructive feedback from colleagues. You need to do your best to make your consumers understand that nothing is personal and that their feedback is critical for helping your team grow.
Some tips for getting this feedback and determining a service satisfaction score for your team:
- Do 1-on-1 interviews with consumers that are open and happy to share their feedback. Make sure you get both the positives and negatives.
- Use anonymous surveys. Note that this approach can't work with small teams. If your product team only has 2 members then the survey isn't really anonymous.
- Ask for feedback from VPs and other managers who are constantly talking to their teams. This will also help protect you from backlash from your own manager who will want to get feedback on your team from other VPs.
Once you can, in some way or another, provide a score on the satisfaction levels of your consumers you should map it to your BI penetration. The most common cause for dissatisfaction from your consumers will be a lack of supply (not enough man hours). Identifying which areas of the business are unhappy with your services, and matching them to a lack of resources in that area, make it very easy for you to argue in favor of growing your team to match the needs of your consumers.
From personal experience, if your tier 1 and tier 2 consumers are above average on the happiness scale, you will be protected and can continue to focus on penetration and training.


