


LinkedIn is an amazing social network but I was recently thinking about one of it's weaknesses.
LinkedIn is built around 2 main objects, people and companies. The weakness is that from a user perspective these two worlds are frustratingly separate.
LinkedIn is unarguably people first. This makes total sense and a huge part of their success. Their product is also focused on the individual and on the goal of building a network of people. The concept of the company comes in a distant second.
For this reason it is difficult for the user to leverage their network when the lens is on the company.
For example, try and find a list of your connections that work at a marketing agency? You can't.
In this post I'm going to share how I built a business development dashboard based on my LinkedIn data in less than one hour for free, and solved this problem. Check out the screenshot below of the final product.
Each circle represents a contact in my network. I can easily filter by Alexa rank, company name, current position of my contacts, and keywords relating to the company.
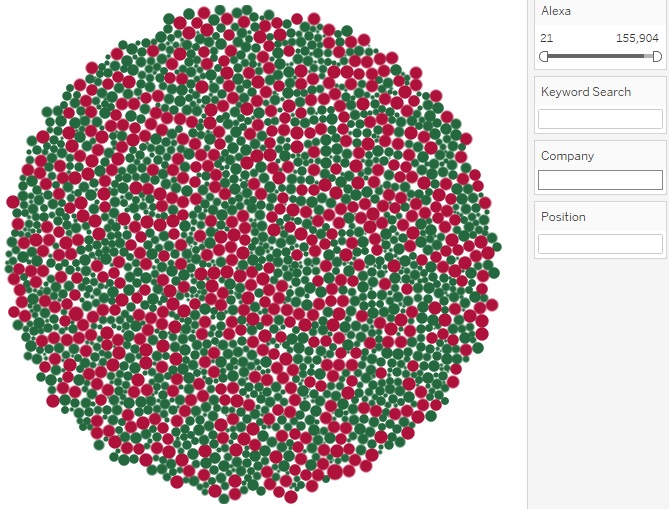
The LinkedIn Business Development Dashboard
Before we dive into the steps I took to build this dashboard let's take a minute to think about our end goal.
My goal was to build an interactive data visualization that would allow me to filter connections in my network based on keywords relating to the companies they work for.
Below is an example of a filtered view in the final dashboard. Notice the term "marketing" in the keyword search box on the right side. By entering the term "marketing" in the search box I managed to filter down to contacts that work at companies involved in marketing.

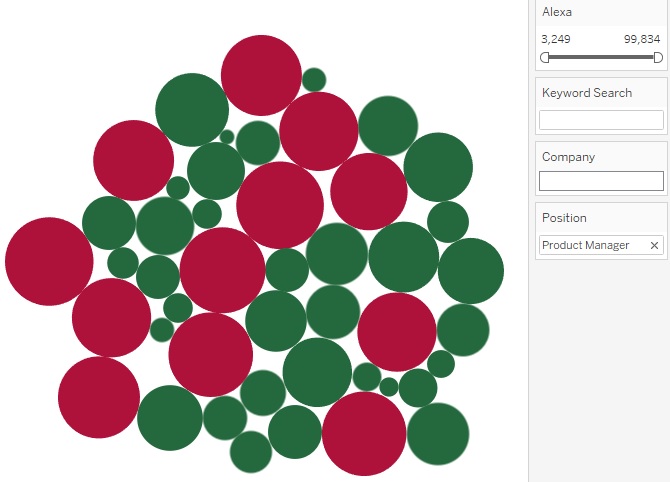
The dashboard isn't only useful for finding contacts from the perspective of the company. I can also search based on current position or company name. The example below shows all the people in my network that are currently working as product managers.
How to build a business development dashboard using LinkedIn and Tableau
Step #1 - Export your network from LinkedIn
The first step in this process is to export your contact list from LinkedIn.
To export your contact list follow the steps below:
- Click the "My Network" icon at the top of your LinkedIn homepage.
- Click "Your connections" on the left rail.
- Click "Manage synced and imported contacts" near the top right of the page.
- Under Advanced actions on the right rail, click "Export contacts".
- Click "Request Archive".
- You will receive an email to your email address with a link where you can download your list of connections.
You can find a detailed breakdown of the steps listed above in this helpful post.
The exported csv should look something like the screenshot below:
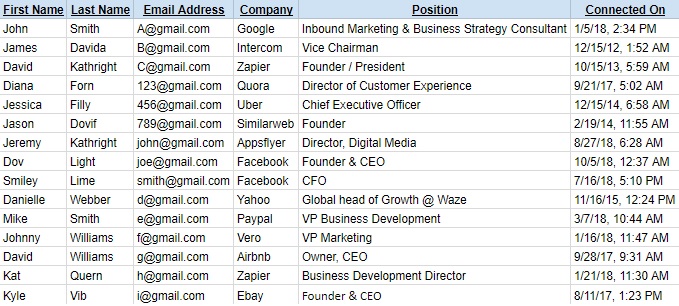
The screenshot above is made up to protect the identities of my network. Your exported spreadsheet should contain a list of all your connections with columns for first name, last name, email, company, position and the date and time when you connected with the connection.
Step #2 - Import the csv into Google Drive
We want to move the csv into Google Drive because we will be doing some basic scripting to enrich our data later in the process.
If you need help with this step check out this post.
Step #3 - Start enriching our data
At this stage we have basic data on our contacts but not enough for us to accomplish our goal.
Before we get into the complex stuff I recommend creating "id" and "full name" columns as shown in the screenshot below. This will become helpful later once we move the data set into Tableau.
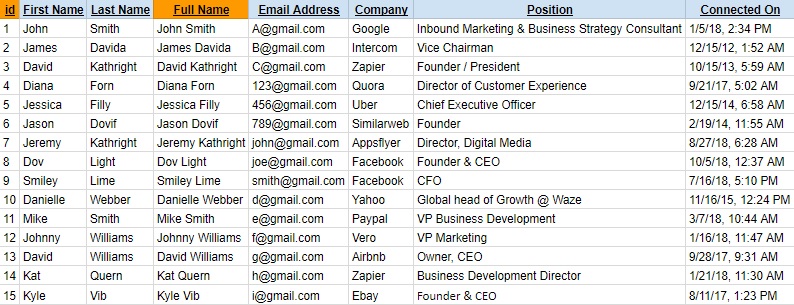
To create the "id" column, you should do a running count of rows (manually add 1,2 and 3 and then double click on the bottom right hand corner of the 4th row to expand the count).
To create the "full name" column use the concatenate formula (=CONCATENATE(B2," ",C2)). You're concatenating first and last name to create full name.
Step #4 - Add domain to your LinkedIn data spreadsheet
Our spreadsheet is starting to take some shape but we still need to add some helper columns.
The next step is to get the domain name of each of the companies in our list.
Thankfully Clearbit has made this step very easy.
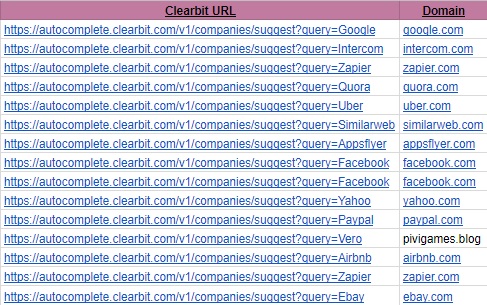
Create a new column called "Clearbit URL" and concatenate https://autocomplete.clearbit.com/v1/companies/suggest?query= and the name of the company.
The exact formula I used is =CONCATENATE("https://autocomplete.clearbit.com/v1/companies/suggest?query=",F2). Since this is a function, just run it down your entire list.
The next step is to open Tools > Script Editor in your Google Sheet and copy paste the code below in the new tab which opens. You'll essentially be building a script which will allow us to get the domain name for each of the companies in our list.
function FETCH(url) {
var response = UrlFetchApp.fetch(url);
Logger.log(response.getContentText());
var out = JSON.parse(response.getContentText());
return out[0]['domain'];
}
Don't forget to save the script.

I must give credit to Badis Khalfallah who wrote about this hack on Medium.
Finally, you can create a new column and enter in the function we created in our script. Enter =fetch(X) where X is the cell holding the Clearbit URL we entered in the previous step.
You should now have the following in your spreadsheet:
Step #5 - Add SEO title, description and keywords to your spreadsheet
Now that we have the domain of each of the companies in our list we can start enriching our spreadsheet with some helpful data.
The first is to get the meta title, description and keywords for each company.
Why is this information useful? Well the title, description and keywords meta data is packed with keywords relating to the business. This information will be used when we run searches in our dashboard.
To get this information for free visit tools.buzzstream.com/meta-tag-extractor. Copy and paste your list of companies in the left hand menu and click on Go. You can then export the results as a CSV and run a vlookup against your spreadsheet data.
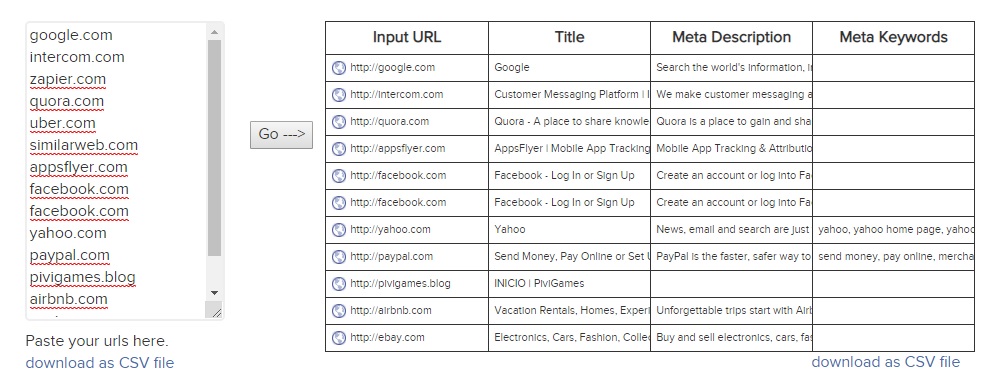
Your spreadsheet should now have 3 extra columns.
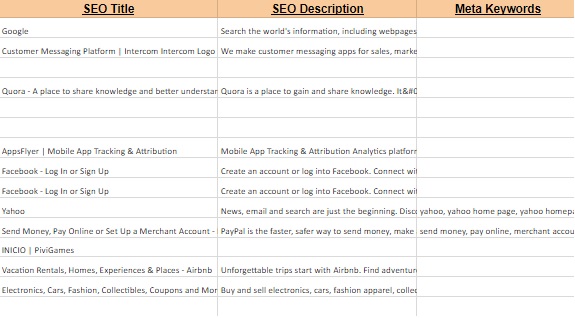
You should now create a new column and concatenate company name, domain, SEO Title, SEO Description and Meta Keywords. You're basically creating one column with all the information we can search against.
The formula looks like this: =CONCATENATE(F2," ",H2," ",I2," ",J2, " ",K2)
Step #6 - Add Alexa Rank to your spreadsheet
Alexa rank is one of the more popular ways to identify the popularity of websites. Alexa isn't the most accurate measurement of popularity but I'd rather have it in my dashboard than have no way to filter by popularity.
You can find the Alexa ranking of the domains in our spreadsheet for free by visiting this site.
Note that not every domain in your list will be present in Alexa's database so you may want to do a vlookup against the output table.
Step #7 - Export the spreadsheet and load into Tableau
After following the steps I've covered so far, you should have a fleshed out spreadsheet with the following columns:
- Id
- First Name
- Last Name
- Full Name
- Email Address
- Company
- Clearbit URL
- Domain
- SEO Title
- SEO Description
- SEO Keywords
- Search Info (concatenation of company, domain, SEO title, SEO description and SEO keywords)
- Alexa Rank
- Position
- Connected At
You should now export the spreadsheet as an excel file which we can then import into Tableau.
Step #8 - Start building your bubble chart in Tableau
I'm not going to go into too much detail on how to build the bubble chart in Tableau. Below is a useful video on creating bubble charts in Tableau.
https://www.youtube.com/watch?v=HlUBnpvhY4c
I would suggest adding Company, Position and Alexa Rank as filters in your view.
Alexa rank should be set as a slider. This will make it easy to filter out companies which are too small / unpopular before searching for a specific keyword. Remember, the lower the Alexa rank the more popular the website.
If you go back to my screenshot of the final dashboard, you will see that the circles are either red or green and have different sizes.
In Tableau you can set a color range with only two colors. This makes it easy to set the color of objects in the visualization based on "is or isnt". In my case I picked an Alexa rank threshold. Any contact that works at a company above that threshold would be colored red. This little trick makes it easy to spot the contacts I should contact first once I've finished filtering.
The same trick can be applied to the size of the circles.
Extra tips and ways to leverage your LinkedIn business development Tableau dashboard
- In my example I enriched my data with domain, SEO meta data and alexa but you don't have to stop there. Tools like Clearbit, Ahref, Buzzsumo and others can help you enrich your spreadsheet with other useful variables.
- Even though I used LinkedIn as my data source, you could repeat this process with the contacts in your CRM.
- Some enrichment options won't cover all cases. Use vlookups to make your life easier.
- If it wasn't clear before, the data set you build won't automatically update itself unless you engineer the creation of the data set using code. This means that if you want to maintain the data set you will need to manually update it every now and then.
- Using a bubble chart is really helpful but a regular table might work better for you.
- I'm a big fan of Tableau and recommend you check it out but there's nothing wrong with using your spreadsheet as your "dashboard". It is definitely a cheaper option but it won't be as pleasurable to use as a Tableau dashboard.


